Intro


My Journey to become a data specialist

2021

The COVID era began to fade, yet still leaving us with uncertainties about the future. During the pandemic, I realized that the most secure jobs were those that could be done remotely, which led me to explore web development.

2022

By this point, I had learned fair amount of HTML, CSS, and JavaScript, but I knew it was not enough to succeed. In April, I enrolled in a two-month Front-End Development Bootcamp, which significantly expanded my skills. To attend, I had to take unpaid leave from my full-time job in construction industry. The bootcamp boosted my confidence and reignited my passion for learning. While I enjoyed coding, it became overwhelming at times, especially since we were learning Angular, where JavaScript evolved into the more complex TypeScript. Without tools like ChatGPT (which didn't exist yet), I had to rely on Google to solve every issue. After the bootcamp, I returned to my daily job and having missed almost two months, I had to take the initiative to make up for lost time. I quickly realized that balancing full-time work while trying to learn new skills was not sustainable. So, I made a decision…

2023

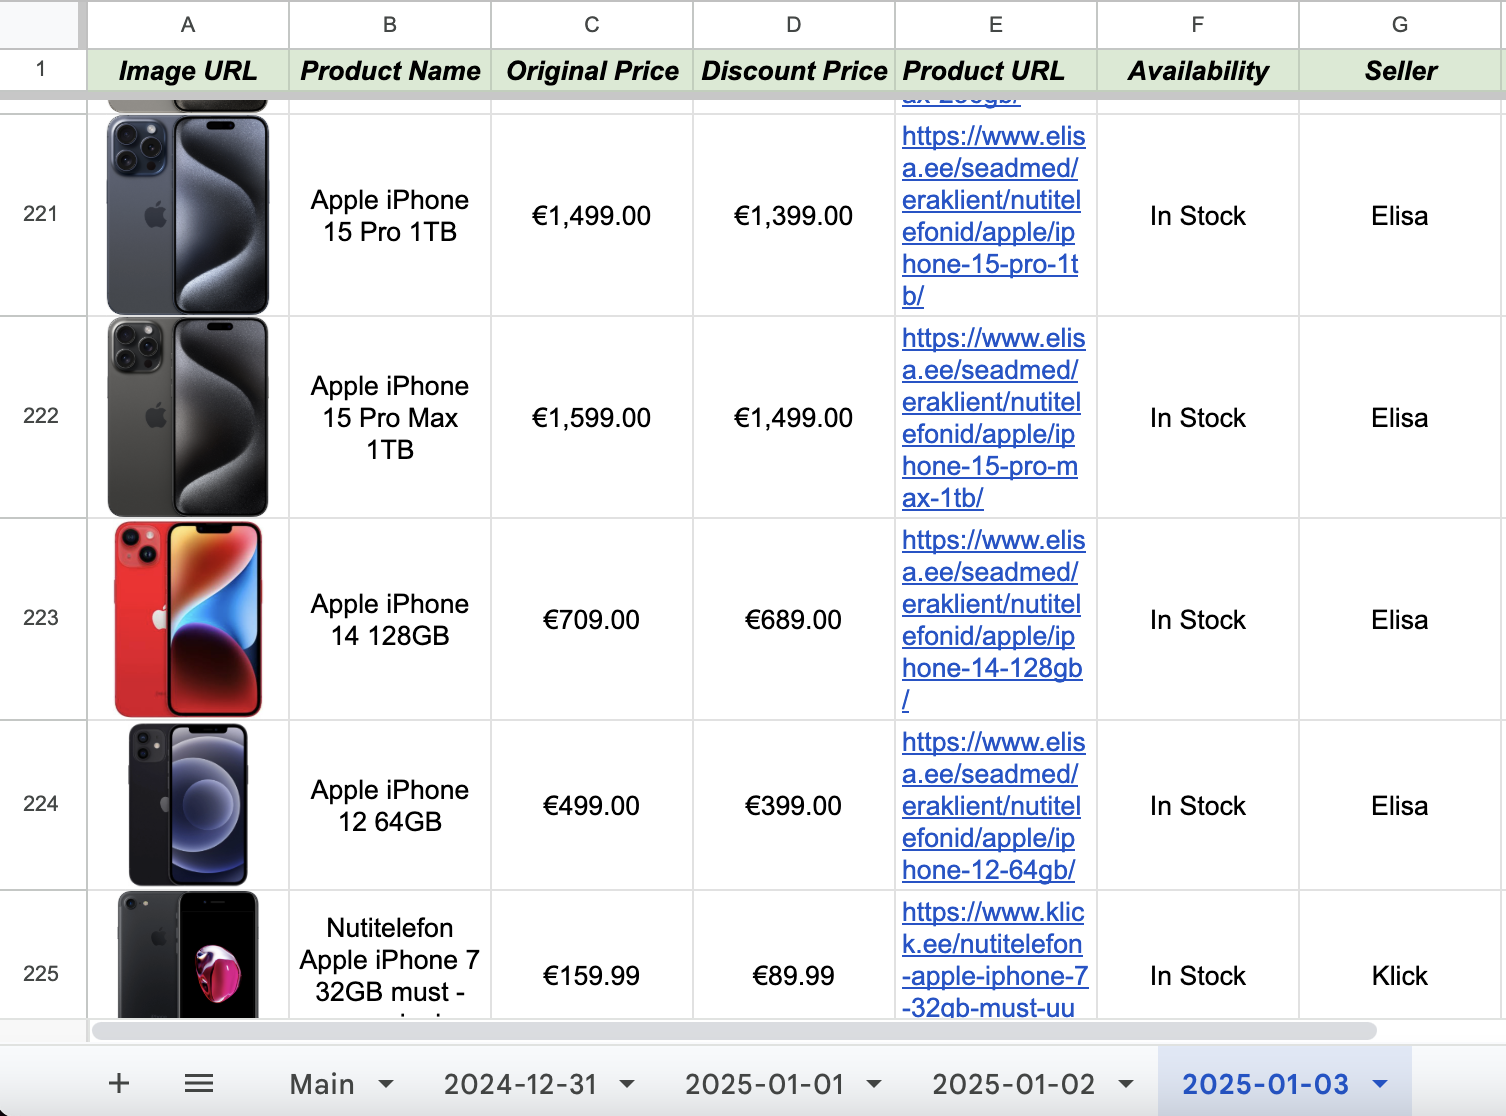
I decided to commit 120% to my job, with the goal of saving enough money and gaining enough credibility to take time off for learning. This effort paid off and I secured a three-month learning holiday in Thailand. I left in December 2022 and returned in March 2023. While I didn't study as much as I intended during the trip, I met digital nomads living the lifestyle I aspired to and I gained valuable insight into in-demand skills. I started noticing terms like SQL, Python, APIs, and the Pandas library popping up in job listings. I didn't fully understand them yet, but I knew they were important for my future. After returning, I dived back into work, energized from the Thailand sun and motivated by new projects. By mid-summer, I had time to revisit my studies. I enrolled in the 100 Days of Python course on Udemy and was immediately hooked. Python’s simple syntax, power and broad usability fascinated me. By the end of summer, I had completed about 25% of the course, but full time job forced me to slow down again. At that point, I realized I needed to fully commit to my new path. My plan was to save enough money to quit my job and focus entirely on programming, aiming for summer 2024 at the earliest — but life had other plans.

2024

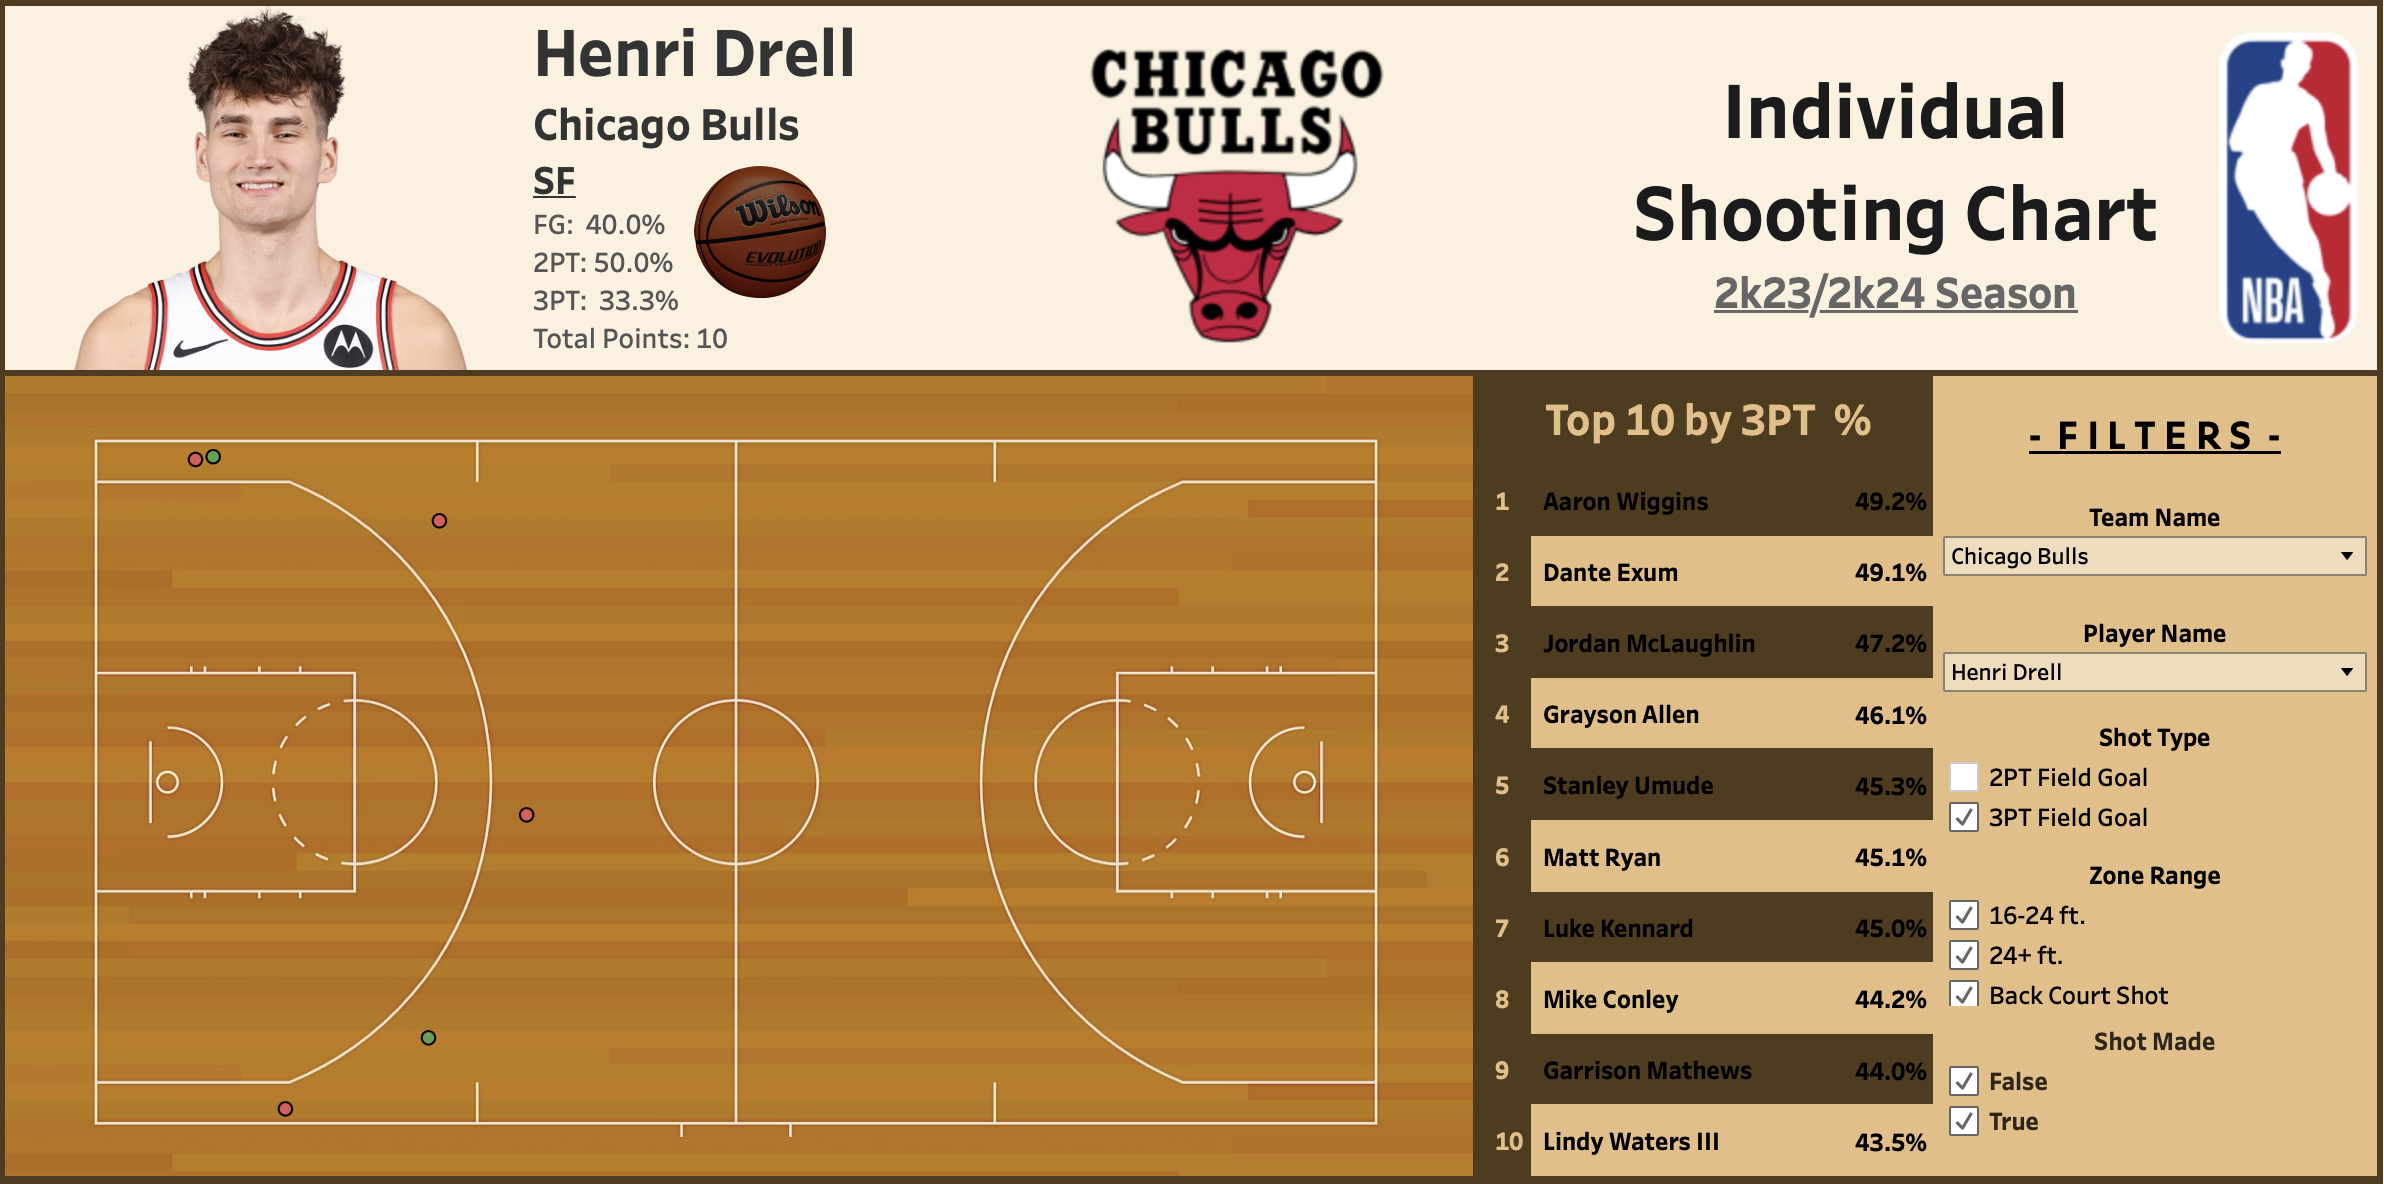
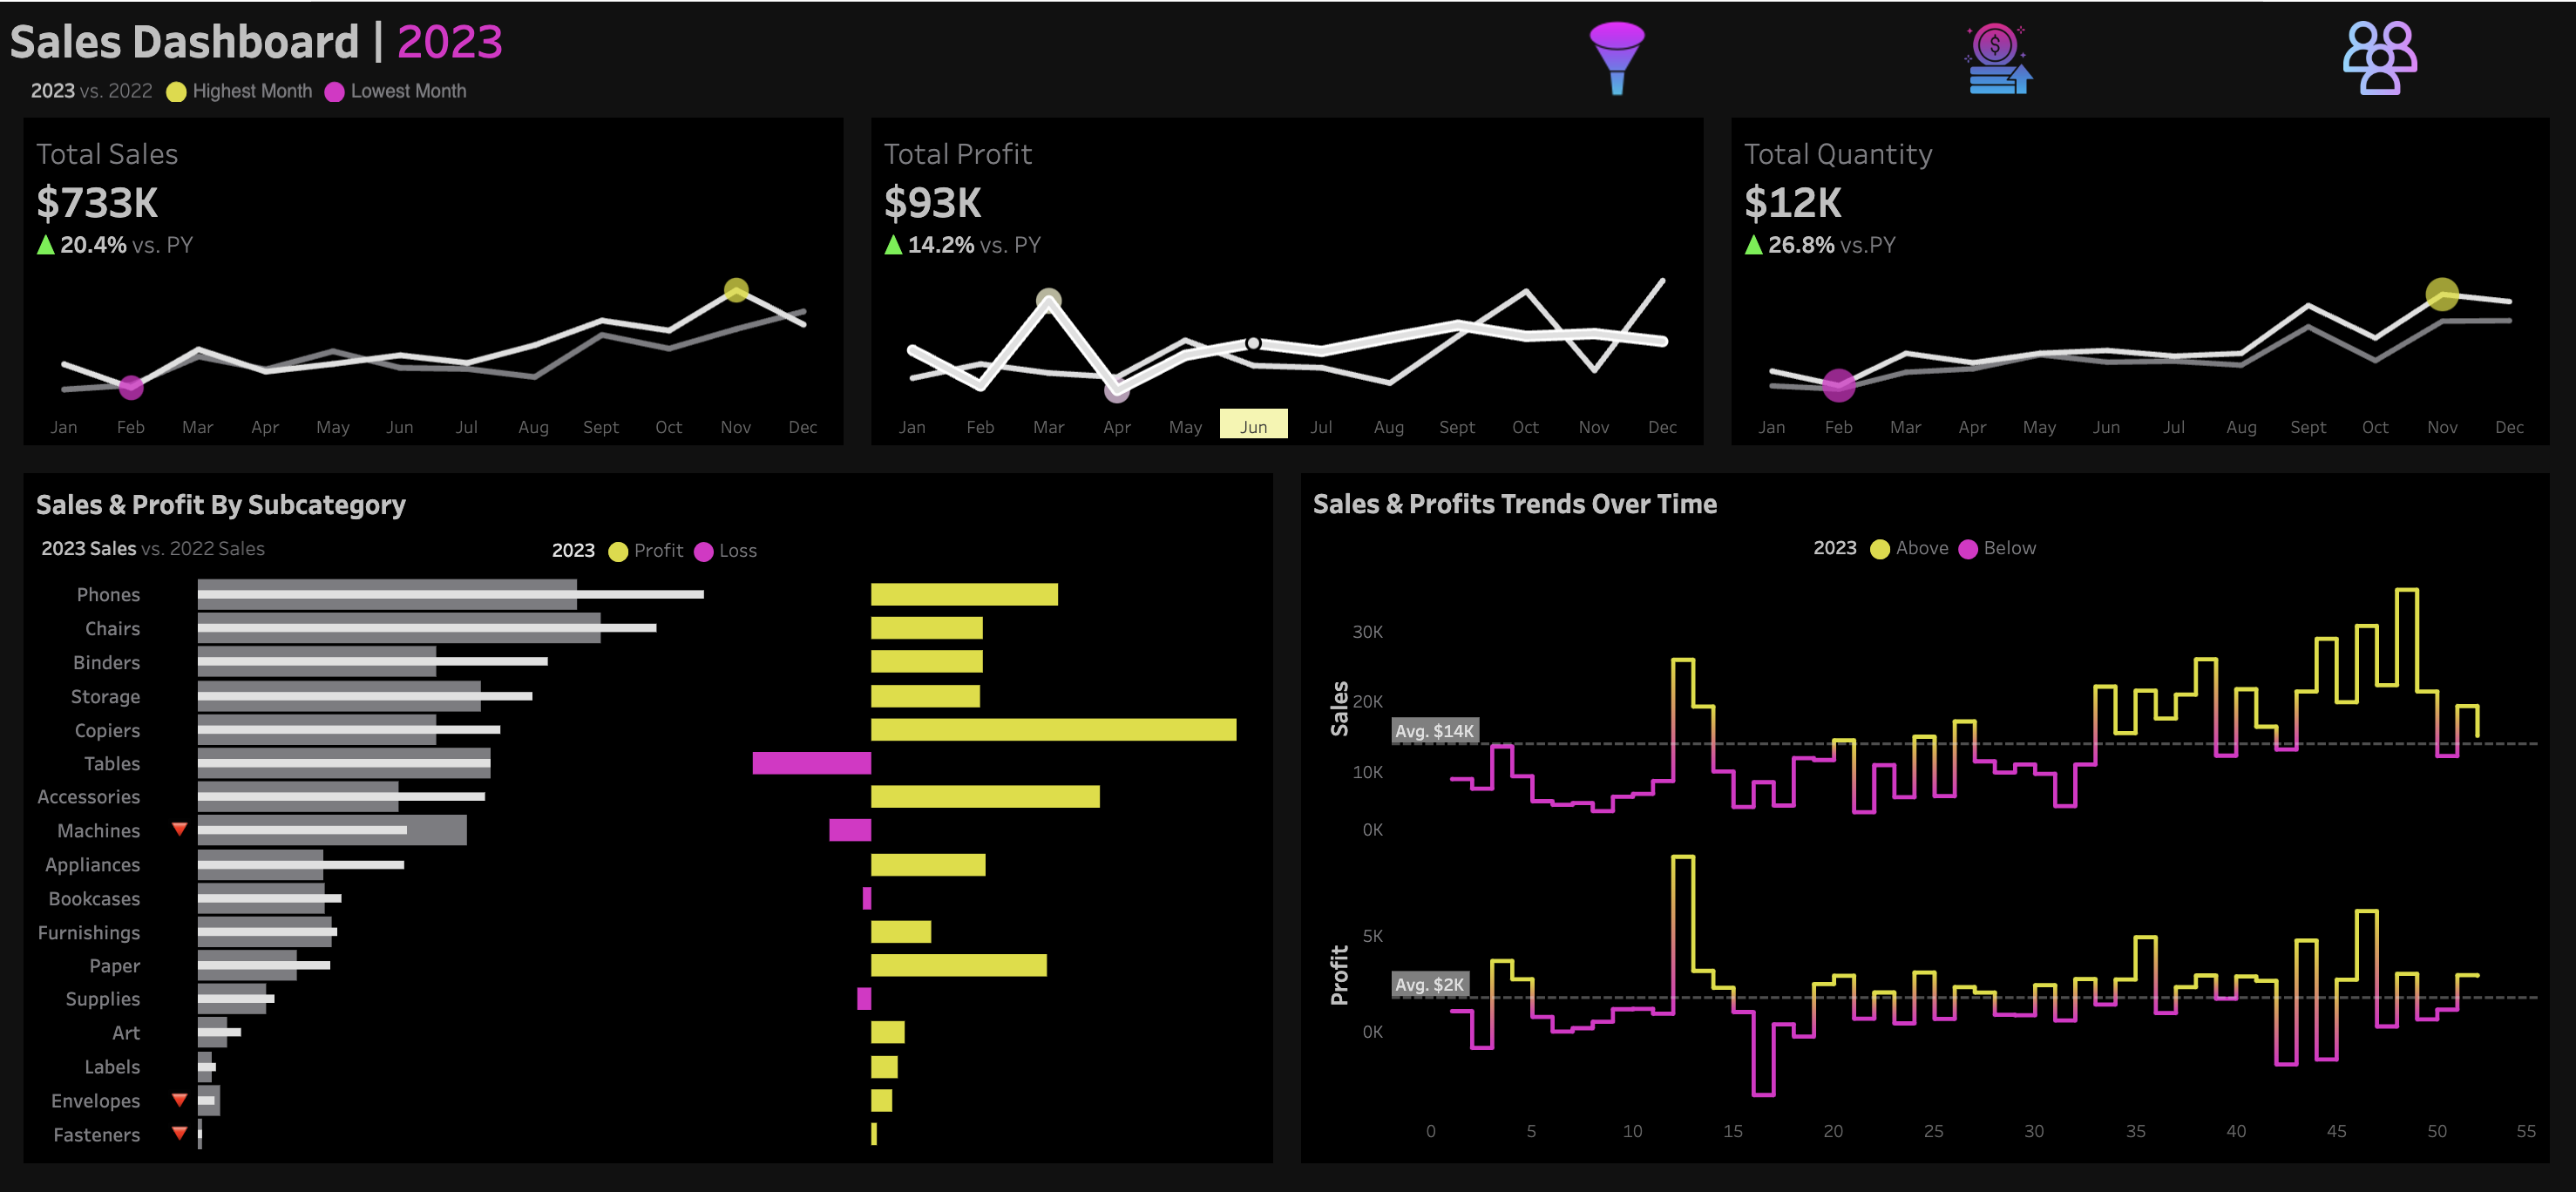
In December 2023, I left my job and returned to Thailand, determined to focus 100% on learning. It felt like a "now or never" moment. I began with Harvard’s CS50 course to solidify my computer science fundamentals, and as I reached the Python chapter, it confirmed my belief that Python was the way to go. After completing CS50, I restarted the 100 Days of Python course, progressing steadily over 4-5 months. The course covered everything from building simple games to deploying modern web apps, but it wasn't until the final section — data analysis and visualization with Python — where I found my true passion. From there, I completed the Google Data Analytics Certificate course, which helped me connect all the dots and clarify my career path. While I haven’t secured a role yet, I’m continuing to improve my skills - for example in Tableau or building custom data pipelines and am eager to begin my first data related position...

Me at the top of Samui

Portfolio

KV.ee Real Estate Dashboard with Google Cloud and Apache Airflow

A custom Python Dash dashboard for real estate analytics, integrating Google Cloud Platform and Apache Airflow for automated workflows. The dashboard features a heatmap filter for Estonian regions, enabling dynamic insights into real estate trends. It includes real-time data scraping from KV.ee, BigQuery storage, and interactive visualizations like average unit price, total listings, and price per sqm for comprehensive regional analysis.
January 2025

Data Collection and Automation Pipeline

An automated pipeline that collects iPhone sales listings data from local retailer websites and uploads the cleaned dataset to Google Sheets daily. Built with Python, Selenium, and Google APIs, the project features modular scrapers for each retailer, automated merging and cleaning of data, and seamless integration with Google Sheets via a secure Google Cloud service account. The pipeline is orchestrated using GitHub Actions to run daily at 1 AM, ensuring consistent data collection for future trend analysis.
January 2025

NBA Individual Shooting Chart

I created an interactive Tableau dashboard to visualize basketball shot locations for NBA players on a full-court background. The dashboard allows users to filter by player and see the positions of made and missed shots represented as circles, color-coded for clarity. The shot data is accurately overlaid on a custom full-court image using proper axis scaling and alignment, showcasing advanced data visualization techniques.
December 2024

Tableau Dashboard

This project marks my first full-scale Tableau endeavor, featuring two comprehensive dashboards: a Sales Dashboard and a Customers Dashboard. The primary goal was to explore and practice the diverse functionality offered by Tableau, from data visualization to interactivity. The dashboards are equipped with custom navigation buttons and a wide range of filters, allowing users to tailor their views and gain insights quickly. Through this project, I’ve developed a deeper appreciation for Tableau's power and versatility, refining my skills in creating interactive and user-friendly dashboards.
November 2024

Bellabeat - Smart Device Usage

This case study was a capstone project of 'Google Data Analytics Certificate'. Bellabeat is a high-tech manufacturer of health-focused products for women. The objective was to give recommendations to the company by analysing open data about smart device usage, collected by competitive manufacturers. In this case study, I demonstrate my ability to use and combine tools like Python, SQL and Google Sheets to gain valuable insights in order to provide top-quality recommendations.
October 2024

Guess the U.S States

I created this guessing game during my Python Bootcamp, which was one of my first experiences working with the pandas library and CSV files. I implemented the Python code into a web UI, allowing users to try it out. The game begins with a blank map of the United States and users must type a state name into the submit box. If user correctly identifies a state, it will be displayed at its correct location on the map. How many states can you guess?
May 2024

About


About me

I’m a motivated and adaptable person with a strong passion for everything related to data - statistics, discovering insights, finding relationships and working with numbers to uncover trends and solve problems. My experiences and dedication have helped me to build a solid foundation for an entry-level data specialist role. I enjoy learning new things and recently completed the Google Data Analytics Professional Certificate, which has strengthened my skills in solving real-world problems with data. Feel free to check out my projects in the work section to see how I've applied my knowledge.


Skills

  • Python

  • SQL

  • Tableau

  • Spreadsheets

  • Git

  • Various AI tools

  • Workflow automation

  • Digital content

  • Critical thinking

  • Problem solving

Education


Professional Experience

  • Dagöstrand, Construction Company

    Team Lead/On-site Manager
    2016-2024
    • Led project teams in executing construction projects across Estonia and the Scandinavian market.
    • Coordinated with clients, suppliers and contractors to ensure project milestones and deadlines were met.
    • Managed project resources and timelines to optimize efficiency and profitability.
    • Oversaw quality control and safety protocols to maintain high standards of workmanship.

Elements

Text

This is bold and this is strong. This is italic and this is emphasized. This is superscript text and this is subscript text. This is underlined and this is code: for (;;) { ... }. Finally, this is a link.


Heading Level 2

Heading Level 3

Heading Level 4

Heading Level 5
Heading Level 6

Blockquote

Fringilla nisl. Donec accumsan interdum nisi, quis tincidunt felis sagittis eget tempus euismod. Vestibulum ante ipsum primis in faucibus vestibulum. Blandit adipiscing eu felis iaculis volutpat ac adipiscing accumsan faucibus. Vestibulum ante ipsum primis in faucibus lorem ipsum dolor sit amet nullam adipiscing eu felis.

Preformatted

i = 0;

while (!deck.isInOrder()) {
    print 'Iteration ' + i;
    deck.shuffle();
    i++;
}

print 'It took ' + i + ' iterations to sort the deck.';

Lists

Unordered

  • Dolor pulvinar etiam.
  • Sagittis adipiscing.
  • Felis enim feugiat.

Alternate

  • Dolor pulvinar etiam.
  • Sagittis adipiscing.
  • Felis enim feugiat.

Ordered

  1. Dolor pulvinar etiam.
  2. Etiam vel felis viverra.
  3. Felis enim feugiat.
  4. Dolor pulvinar etiam.
  5. Etiam vel felis lorem.
  6. Felis enim et feugiat.

Icons

Actions

Table

Default

Name Description Price
Item One Ante turpis integer aliquet porttitor. 29.99
Item Two Vis ac commodo adipiscing arcu aliquet. 19.99
Item Three Morbi faucibus arcu accumsan lorem. 29.99
Item Four Vitae integer tempus condimentum. 19.99
Item Five Ante turpis integer aliquet porttitor. 29.99
100.00

Alternate

b
Name Description Price
Item One Ante turpis integer aliquet porttitor. 29.99
Item Two Vis ac commodo adipiscing arcu aliquet. 19.99
Item Three Morbi faucibus arcu accumsan lorem. 29.99
Item Four Vitae integer tempus condimentum. 19.99
Item Five Ante turpis integer aliquet porttitor. 29.99
100.00

Buttons

  • Disabled
  • Disabled

Form